Open source
Agentic BI
for Founders.
Your data stack, staffed by agents.

Every founder wants to do 3 things with their data
# analytics-internal
Your data stack, staffed by agents.
Every founder wants to do 3 things with their data
See MinusX in action

Why MinusX
[0] MinusX is SOTA and #1 on DataAgentBench, a realistic benchmark for data tasks from UC Berkeley's EPIC lab.
Self-host: your infra, your LLM keys. Nothing leaves your environment.
Cloud: we run the BI + agent layer. Get started in seconds. Optionally bring your own LLM keys.

Writing SQL is ~25% of analyst work. MinusX handles that, and everything else too, like dashboards, metrics, docs, alerts. Built from the ground up for agents, not a chatbot bolted on to a BI tool.
Most data agents fail because they don't understand your company. MinusX auto-learns context from every interaction, and you can test it with Evals.
MinusX is SOTA on DataAgentBench, a realistic benchmark for data tasks from UC Berkeley's EPIC lab.
Batteries included
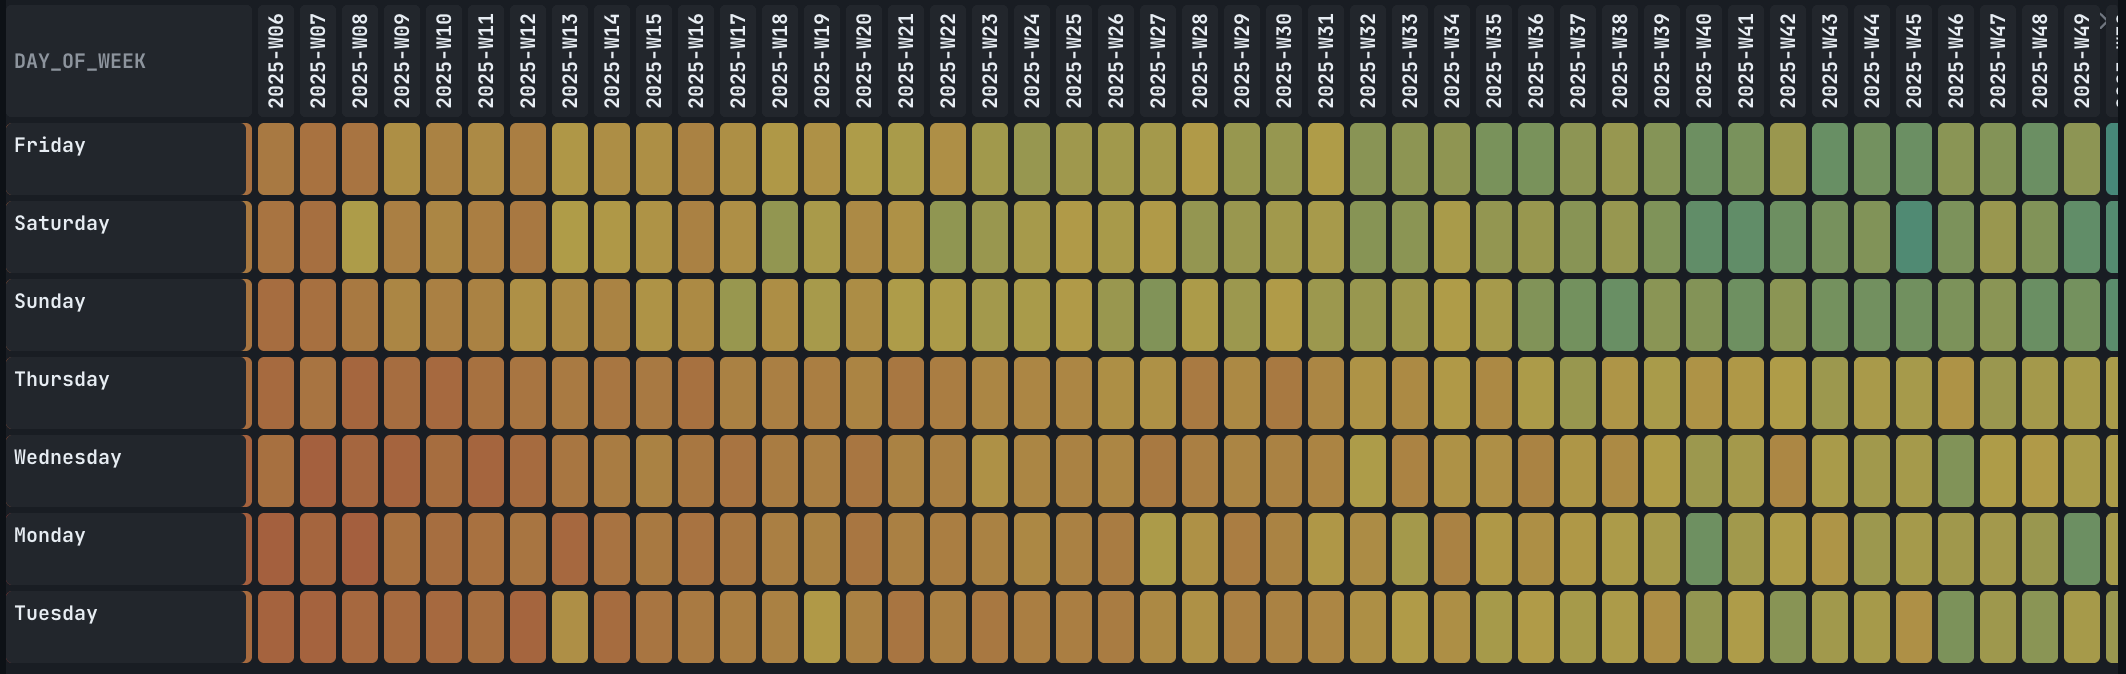
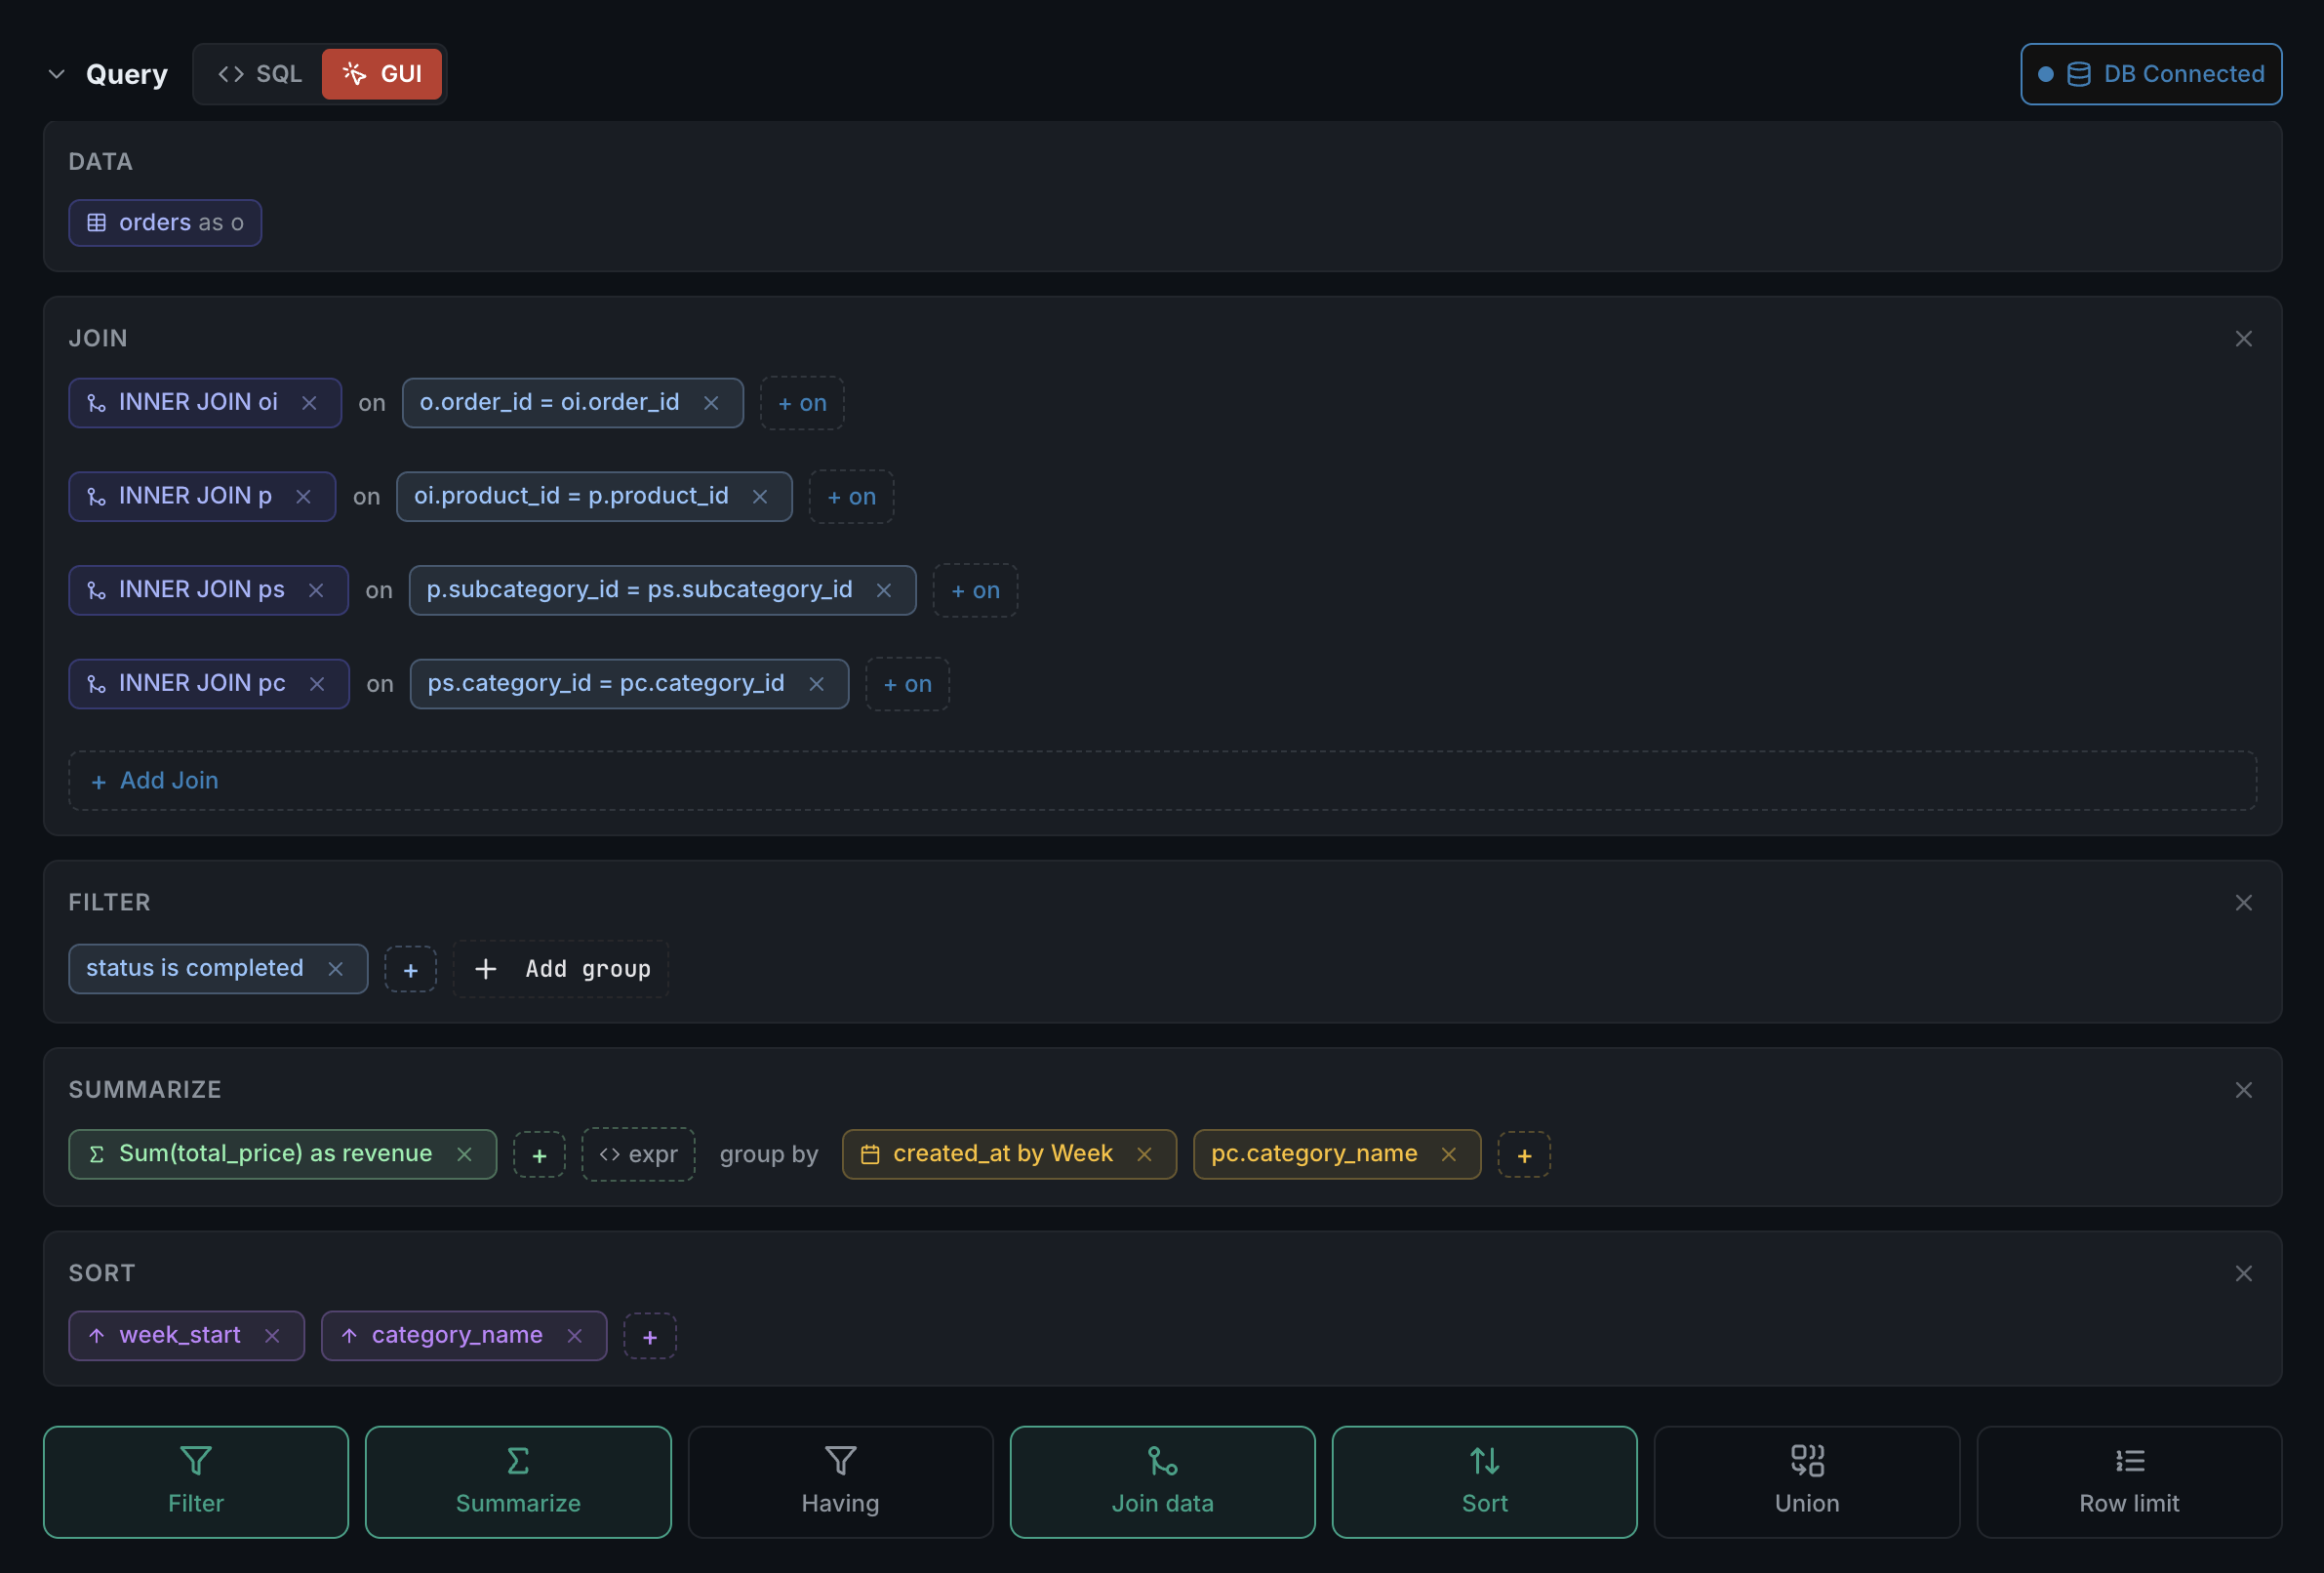
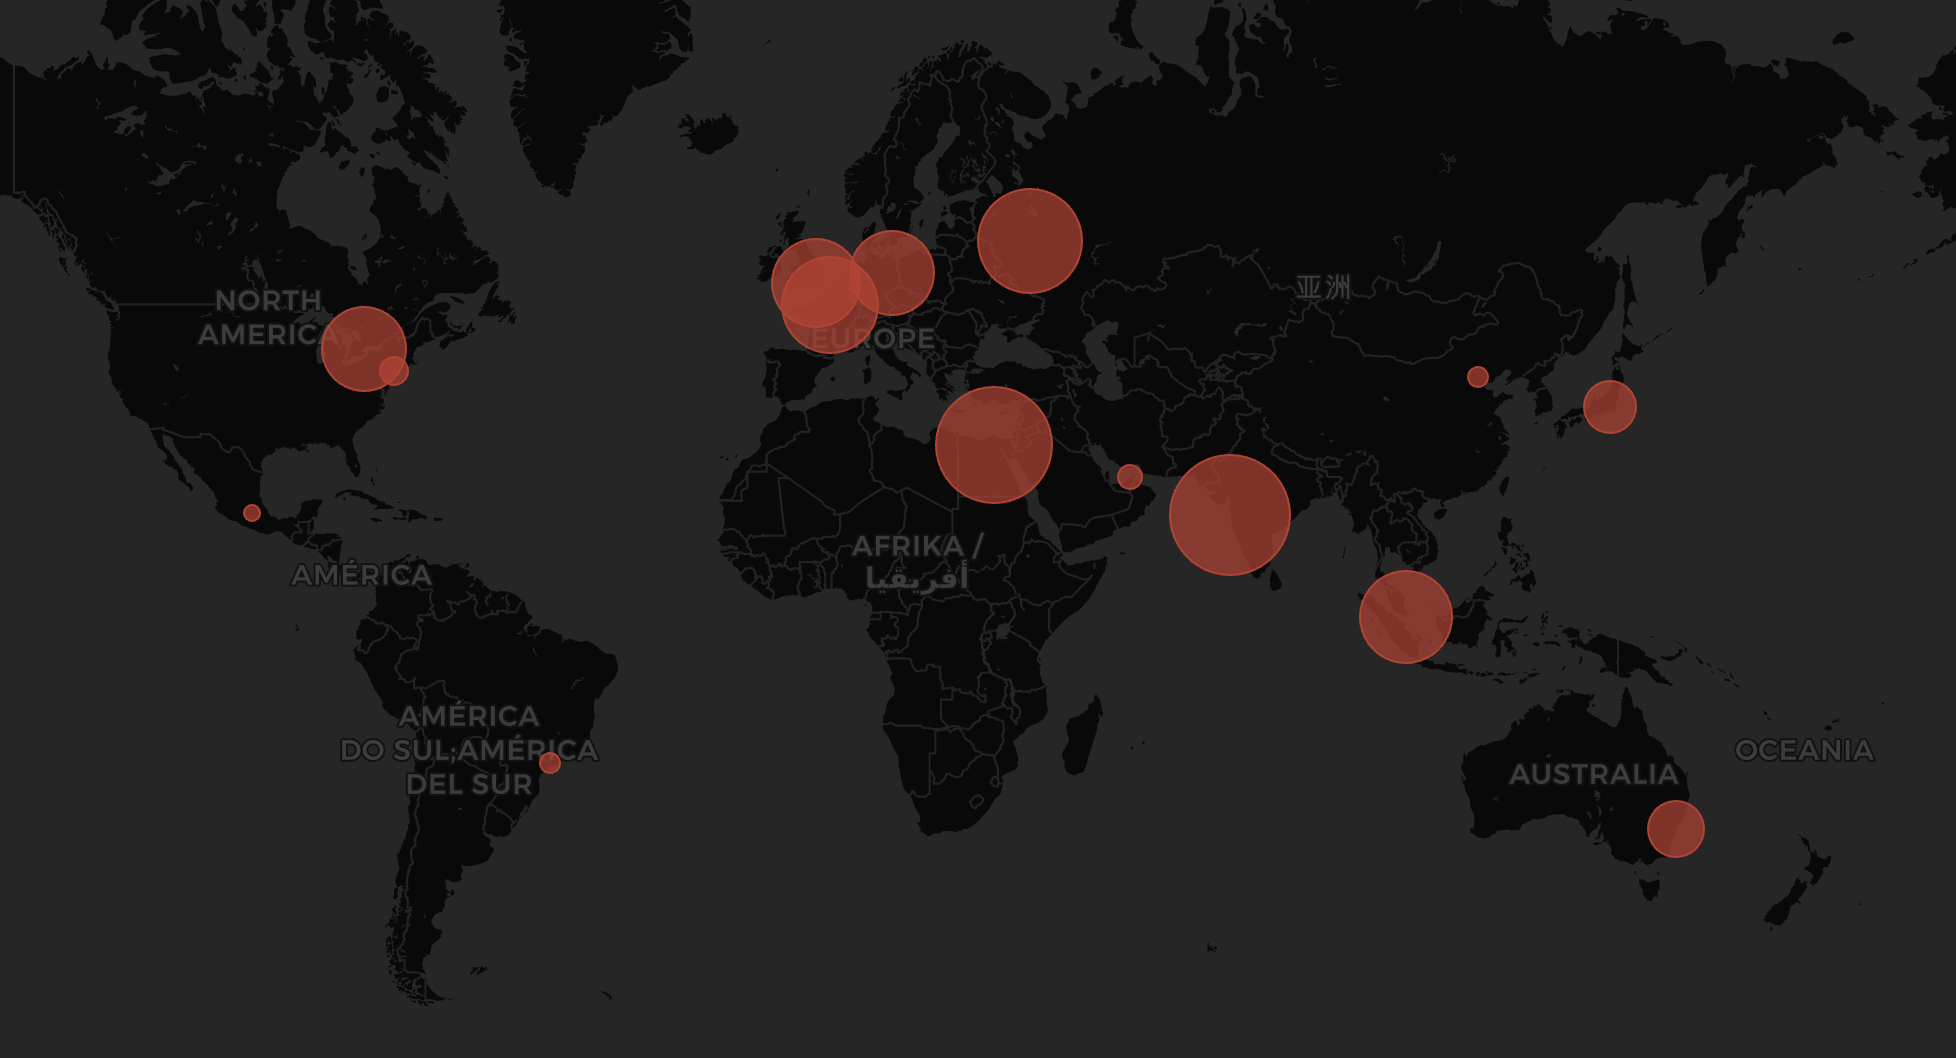
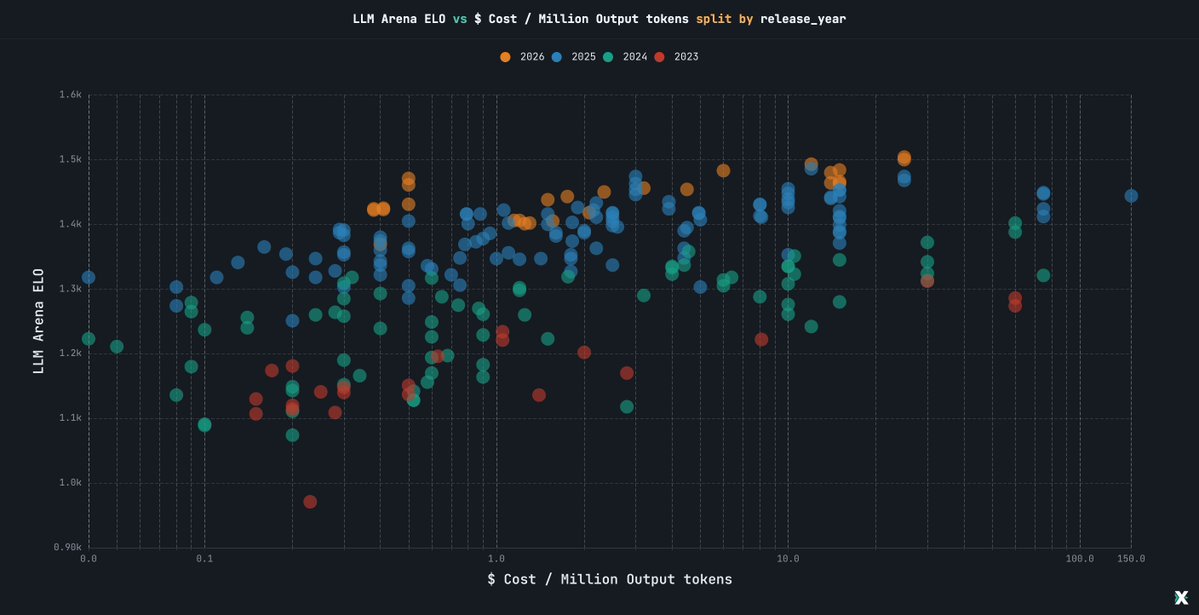
Build rich visualizations (maps, funnels, GitHub-like heatmaps, etc). Configure advanced filters via SQL or a query builder.


Connect Postgres, BigQuery, and more. Upload CSVs or even Google Sheets for quick analysis.
See all data sources


Ask questions from Slack or expose the MCP server for your AI agents. Analytics that fits into the modern AI workflow.
See all integrationsScheduled reports, threshold alerts, and proactive nudges. MinusX watches your data so you don't have to.
Learn about proactiveMinusX grows with your needs. From looking at rows of your Supabase, to building dashboards for your team, to advanced reporting and proactive analytics.
 From the creators of the #1 rated Metabase AI assistant
Teams use our Metabase AI assistant to power their analytics. MinusX BI takes everything we learned and cranks it to 100.

“Our users love AI Chat, especially when MinusX creates GUI Metabase questions that they can follow along. I recently did ~6hrs of SQL work in less than an hour.”
Julian Rowlands
CEO @ Cashboard
“MinusX has completely transformed analytics at Habuild. Analyzing the effect of any initiative used to take more than a week. Now every member is empowered to look at data themselves.”
Prasun Jain
Head of Product @ Habuild
“I've been using GenAI in Hex as well, and honestly, yours works much better. Can't wait to supercharge it with more context.”
Hugo Pardo
Analytics and Data @ Meili Travel
“I genuinely wouldn't have tried an analysis had I not had this tool. And 0 errors!”
Apoorv Saxena
Research Scientist @ Adobe
“This is brilliant. Super easy to use and can handle even the most complex cases!”
Astha Jakher
Chrome Web Store review
“Our non-tech business folks are loving the Metabase version.”
Sandipan Mitra
Chrome Web Store review
“I am from a non-technical background and I just need to prompt the right words and my SQL queries are ready.”
Darshan Badaik
Chrome Web Store review
“Very useful in Metabase :)”
Adam Rebai
Chrome Web Store review
“Super helpful!”
Lara Schiavi
Chrome Web Store review
Switching from Metabase, Redash, or another BI tool? We'll migrate you in 1 day →


